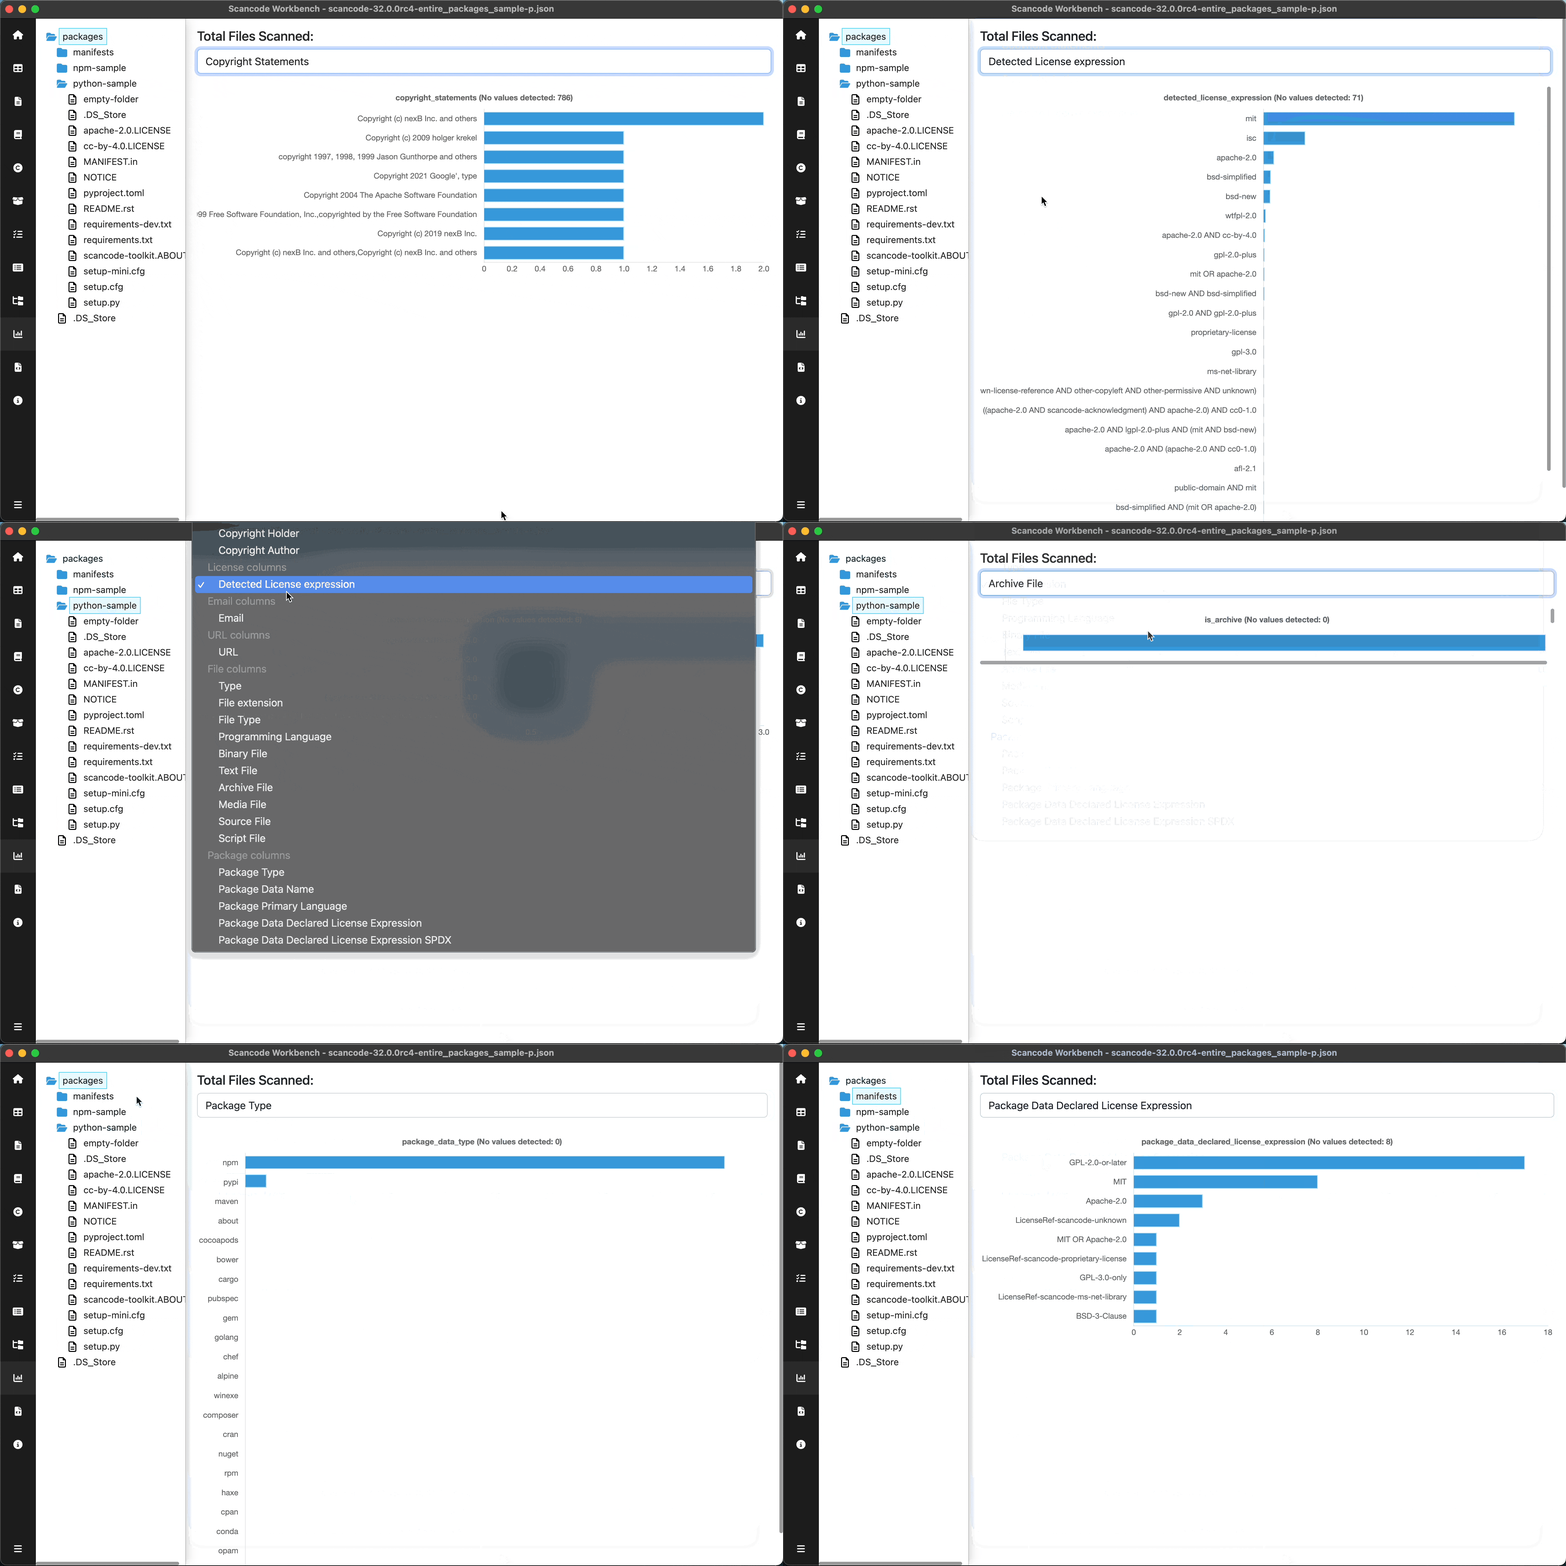
Chart Summary View
With the chart summary view, a user can select a node in the directory tree (i.e., a directory, folder or file) and display a horizontal bar chart listing the values identified in the scanned codebase, i.e. the ScanCode Toolkit detections, for a number of different attributes.
The attributes are a subset of the columns displayed in the table view, and can be selected by clicking the dropdown at the top of the view. The chart displays the full range of values for the selected directory tree node and attribute and the number of times each value occurs in the scanned codebase.

Note
Refer the titlebar to see the name of the sample scan used in the screenshot. Sample scans: