How-To: Navigate the Chart Summary View
Display the Chart Summary view
Once you have a SQLite file loaded into ScanCode Workbench, displaying the Chart Summary View is easy:
Select a file or directory in the Tree View on the left.
Click on Chart Summary View in the sidebar or open the View menu and select Chart Summary View (keyboard shortcut: Ctrl+Shift+D or ⌘+Shift+D).
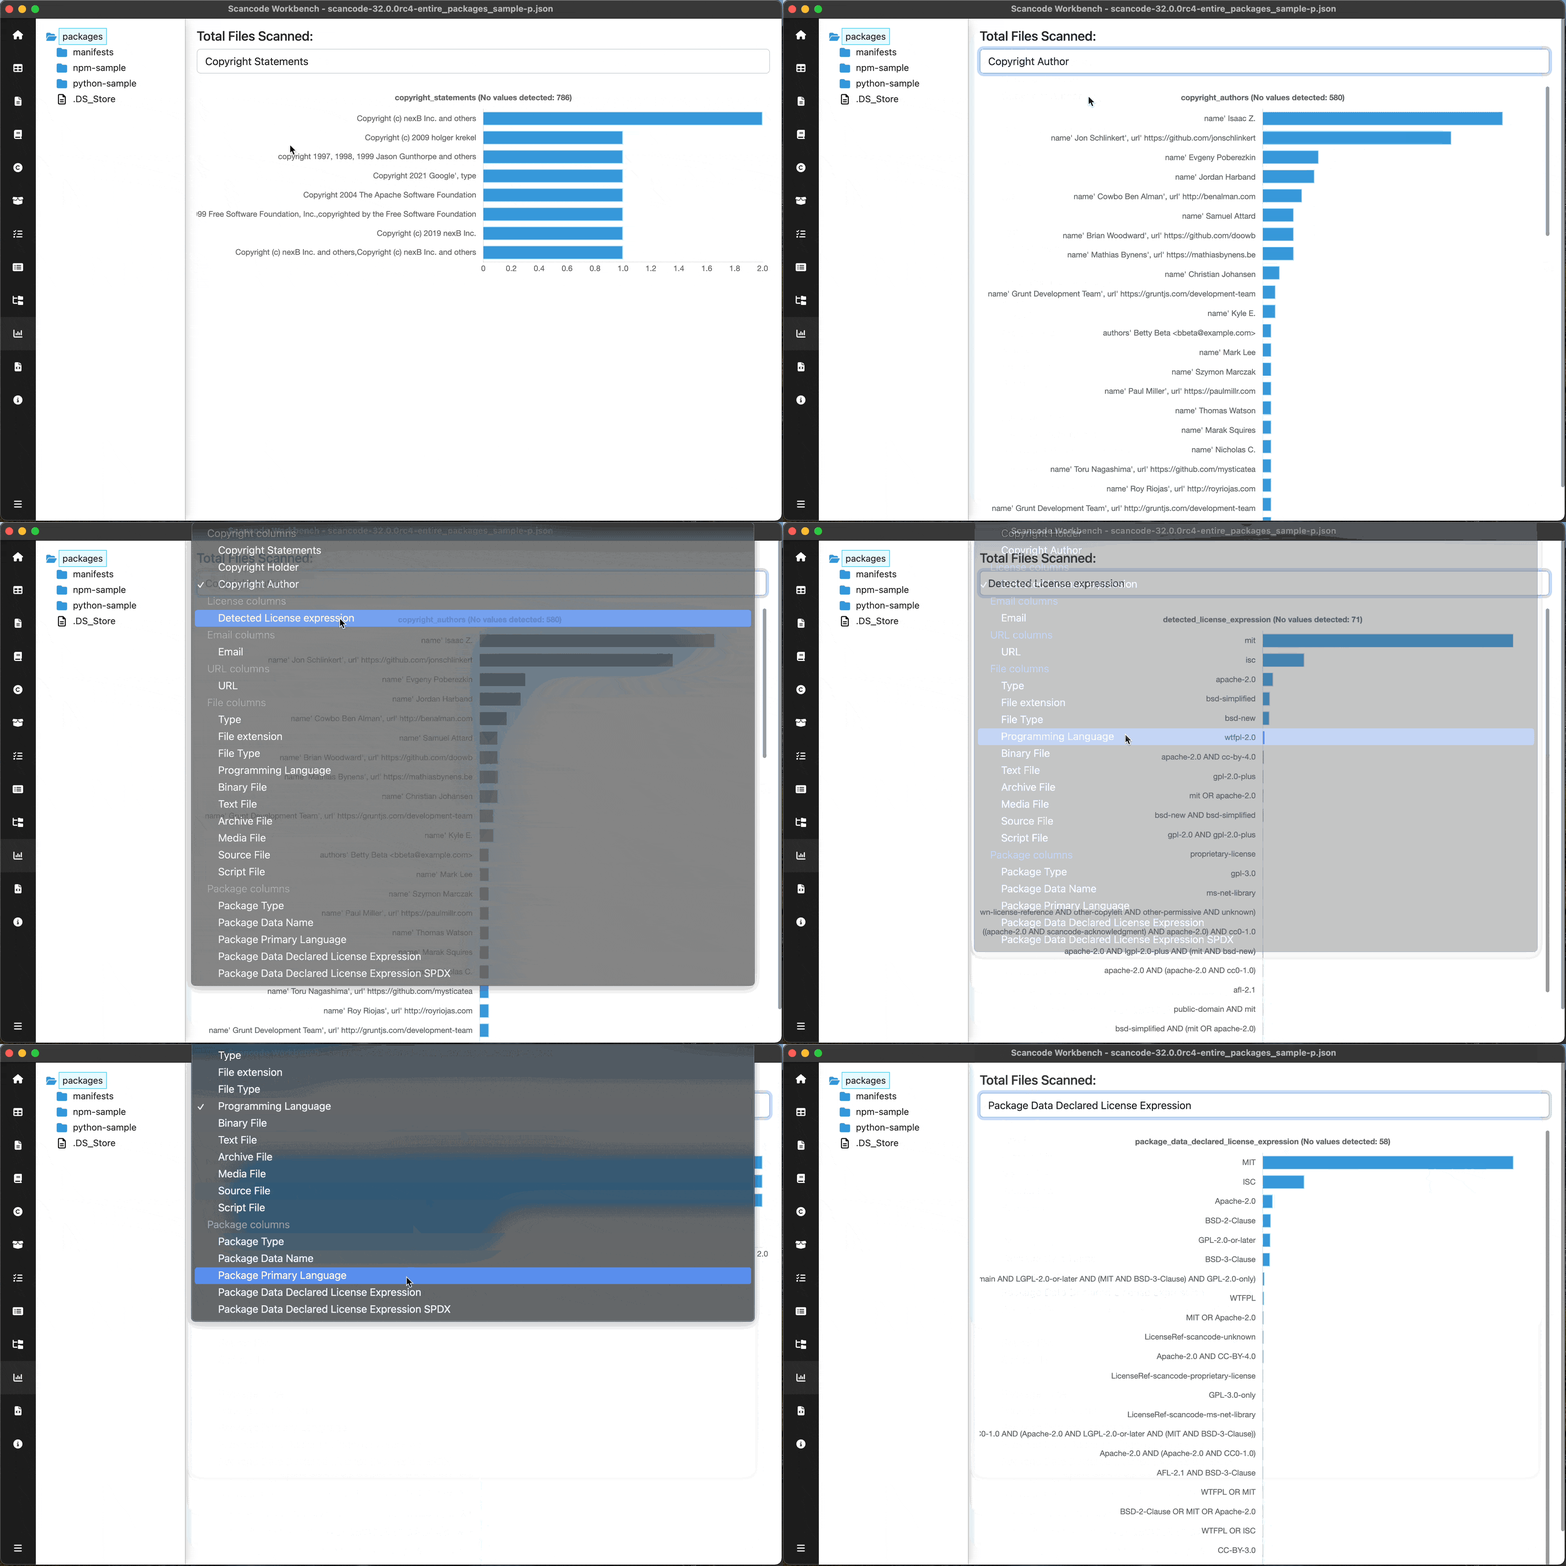
Select an attribute
Use the dropdown at the top of the view to select the attribute you want to
examine (e.g., Copyright Statements, Detected License expression). These attribute values
are detected from ScanCode, and can also be viewed in the Table View.
When you select an attribute, the Chart Summary View will automatically refresh to display a horizontal bar chart showing – in descending order of frequency – each value identified in the scanned codebase for the selected attribute and the number of times it occurs in the codebase. You can also see the value for a particular entry in the bar chart in a tooltip that appears when you move your cursor over the text on the left or the bar on the right.

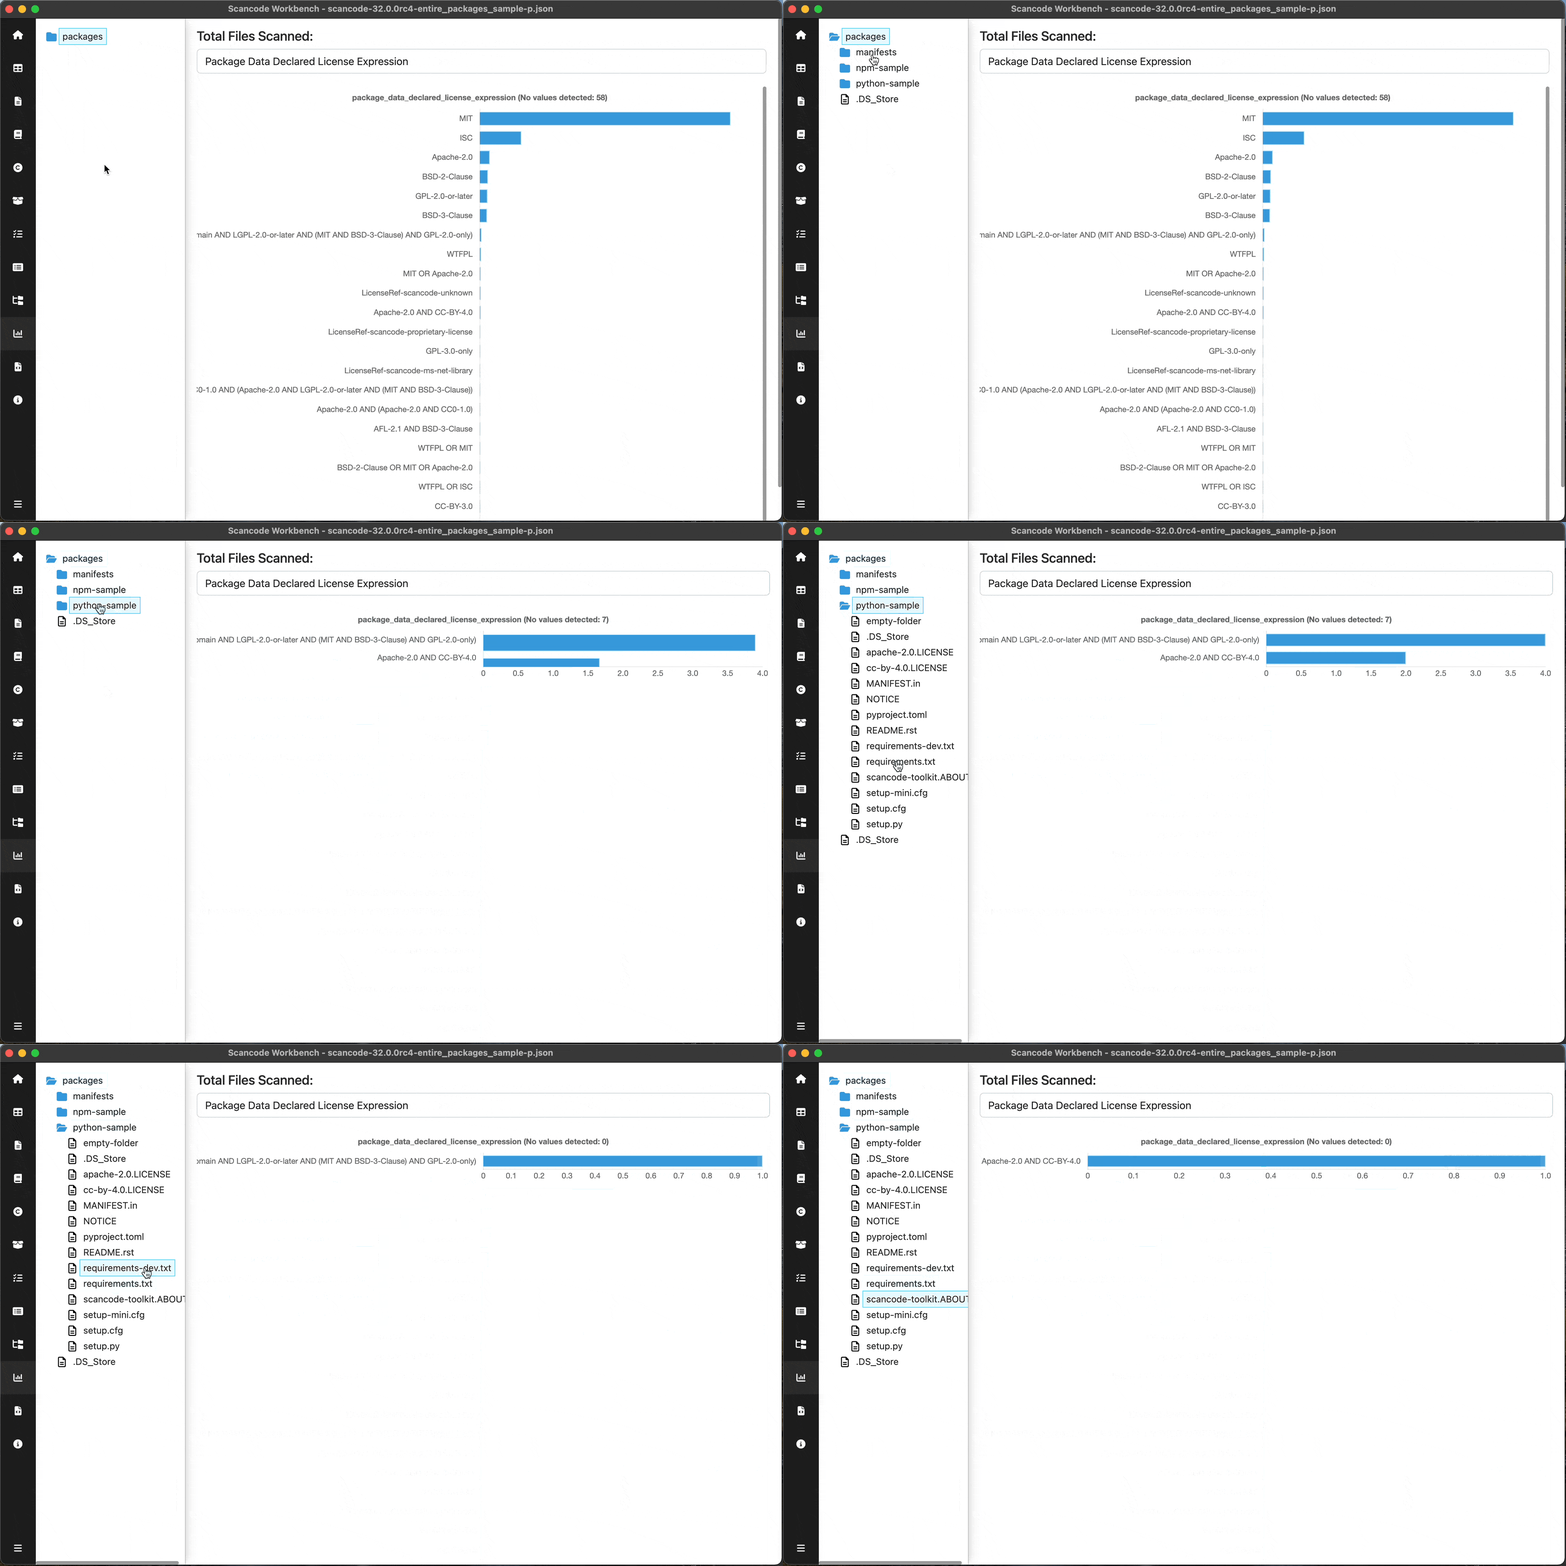
Filter Chart Summary
You can further filter the summary results by choosing a specific directory or file in the Tree View. The chart will then only show results for that selected directory or file.

For entire UI reference, Read Chart Summary View
Note
Refer the titlebar to see the name of the sample scan used in the screenshot. Sample scans: